575 lines
30 KiB
Markdown
575 lines
30 KiB
Markdown

|
|
|
|
# AAChartCore
|
|
|
|
|
|
[](https://www.apple.com/nl/ios/)
|
|
[](https://github.com/AAChartModel/AAChartKit-Swift/blob/master/LICENSE)
|
|
[](https://github.com/AAChartModel/AAChartKit-Swift)
|
|
[](https://github.com/AAChartModel/AAChartKit-Swift/blob/master/CHINESE-README.md#当前已支持的图表渲染动画类型有三十种以上说明如下)
|
|
[](https://github.com/AAChartModel/AAChartKit)
|
|
[](https://github.com/AAChartModel/AAChartKit-Swift/blob/master/CHINESE-README.md)</br>
|
|
[](https://github.com/AAChartModel/AAChartKit-Swift)
|
|
[](http://isitmaintained.com/project/AAChartModel/AAChartKit-Swift "Average time to resolve an issue")
|
|
[](http://isitmaintained.com/project/AAChartModel/AAChartKit-Swift "Percentage of issues still open")
|
|
|
|
|
|
## [ **English Document 🇬🇧** ](https://github.com/AAChartModel/AAChartCore) | [ **简体中文文档 🇨🇳** ](https://github.com/AAChartModel/AAChartCore/blob/master/CHINESE-README.md)
|
|
|
|
### 您所喜爱的`AAChartCore`开源图表框架同时更有`Kotlin`版本可供使用,详情请点击以下链接
|
|
### 传送门
|
|
#### *https://github.com/AAChartModel/AAChartCore-Kotlin*
|
|
|
|
## 前言
|
|
|
|
***AAChartCore***,是 [AAChartKit](https://github.com/AAChartModel/AAChartKit) 的 `Java`语言版本,是在流行的开源前端图表框架的基础上,封装的面向对象的,一组简单易用,极其精美的图表绘制控件.可能是这个星球上 UI 最精致的第三方 Android 开源图表框架了(✟我以无神论者的名义向上帝起誓🖐,我真的没有在说鬼话✟)
|
|
|
|
***
|
|
## 功能特性
|
|
|
|
1. **环境友好,兼容性强**. 支持 `Kotlin`语言,配置简单.同时更有 Objective-C 版本[AAChartKit](https://github.com/AAChartModel/AAChartKit)可供使用.
|
|
|
|
1. **功能强大,类型多样**. 支持`柱状图` 、`条形图` 、`折线图` 、`曲线图` 、`折线填充图` 、`曲线填充图`、`雷达图`、`极地图`、`扇形图`、`气泡图`、`散点图`、`区域范围图`、`柱形范围图`、`面积范围图`、`面积范围均线图`、`直方折线图`、`直方折线填充图`、`箱线图`、`瀑布图`、`热力图`、`桑基图`、`金字塔图`、`漏斗图`、等二十几种类型的图形,不可谓之不多.
|
|
|
|
1. **现代化声明式语法**. 与过往的命令式编程技巧不同, 在 AAChartKit 中绘制任意一款自定义图表, 你完全无需关心挠人的内在实现细节. 描述你所要得到的, 你便得到你所描述的.
|
|
|
|
1. **细致入微的用户自定义功能**. 基础的`主标题`、`副标题`、`X 轴`、`Y 轴`自不必谈, 从纵横的`交互准星线`、跟手的`浮动提示框`, 到切割数值的`值域分割线`、`值域分割颜色带`, 再到细小的`线条`类型,`标记点`样式, 各种细微的图形子组件, 应有尽有. 以至于不论是`极简`、抽象的小清新风格, 还是纷繁`复杂`的严肃商业派头, 均可完美驾驭.
|
|
|
|
1. **交互式图形动画**. 有着清晰和充满细节的用户交互方式,与此同时,图形渲染`动画`效果细腻精致,流畅优美.有三十多种以上渲染动画效果可供选择,用户可自由设置渲染图形时的动画时间和动画类型,关于图形渲染动画类型,具体参见[ AAChartCore 动画类型](#当前已支持的图表渲染动画类型有三十种以上说明如下).
|
|
|
|
1. **极简主义**. `AAChartView + AAChartModel = Chart`,在 ***AAChartCore*** 数据可视化图形框架当中,遵循这样一个极简主义公式:`图表视图控件 + 图表模型 = 你想要的图表`.同另一款强大、精美而又易用的开源图形框架 [AAChartKit](https://github.com/AAChartModel/AAChartKit)完全一致.
|
|
|
|
1. **链式编程语法**. 支持系统类推荐的 `链式编程语法`,一行代码即可配置完成 `AAChartModel`模型对象实例.
|
|
|
|
1. **简洁清晰,轻便易用**. 最少仅仅需要 **五行代码** 即可完成整个图表的绘制工作(使用链式编程语法配置 `AAChartModel` 实例对象时,无论你写多少行代码,理论上只能算作是一行). 😜😜😜
|
|
|
|
1. **交互事件回调** 支持图表的[用户点击事件及单指滑动事件](#支持监听用户点击事件及单指滑动事件), 可在此基础上实现双表联动乃至多表联动,以及其他更多更复杂的自定义用户交互效果.
|
|
|
|
1. **支持手势缩放**.支持图表的手势缩放和拖动阅览,手势缩放类型具体参见[ AAChartCore 手势缩放类型](#当前已支持的图表手势缩放类型共有三种说明如下),默认禁用手势缩放功能.
|
|
|
|
***
|
|
|
|
## 真机美图
|
|
|
|
<div>
|
|
<img src='https://github.com/AAChartModel/loadHtmlCssJsDemo-master/blob/master/AAChartKit/BeautyAppreciation/ColumnChart.png' width="24%" >
|
|
<img src='https://github.com/AAChartModel/loadHtmlCssJsDemo-master/blob/master/AAChartKit/BeautyAppreciation/BarChart.png' width="24%" >
|
|
<img src='https://github.com/AAChartModel/loadHtmlCssJsDemo-master/blob/master/AAChartKit/BeautyAppreciation/AreaChart.png' width="24%" >
|
|
<img src='https://github.com/AAChartModel/loadHtmlCssJsDemo-master/blob/master/AAChartKit/BeautyAppreciation/LineChart.png' width="24%" >
|
|
</div>
|
|
|
|
<div>
|
|
<img src='https://github.com/AAChartModel/loadHtmlCssJsDemo-master/blob/master/AAChartKit/BeautyAppreciation/StepAreaChart.png' width="24%" >
|
|
<img src='https://github.com/AAChartModel/loadHtmlCssJsDemo-master/blob/master/AAChartKit/BeautyAppreciation/StepLineChart.png' width="24%" >
|
|
<img src='https://raw.githubusercontent.com/AAChartModel/Gallery/master/AAChartKit/splineChart.png' width="24%" >
|
|
<img src='https://raw.githubusercontent.com/AAChartModel/Gallery/master/AAChartKit/areasplineChart.png' width="24%" >
|
|
</div>
|
|
|
|
<div>
|
|
<img src='https://raw.githubusercontent.com/AAChartModel/Gallery/master/AAChartKit/percentStackingAreasplineChart.png' width="24%" >
|
|
<img src='https://github.com/AAChartModel/Gallery/blob/master/AAInfographics/BubbleChart.png' width="24%">
|
|
<img src='https://github.com/AAChartModel/Gallery/blob/master/AAInfographics/ArearangeAverageValueChart.png' width="24%">
|
|
<img src='https://github.com/AAChartModel/Gallery/blob/master/AAInfographics/ColumnMixedLineChart.png' width="24%">
|
|
</div>
|
|
|
|
<div>
|
|
<img src='https://raw.githubusercontent.com/AAChartModel/Gallery/master/AAChartKit/scatterChart.png' width="24%" >
|
|
<img src='https://raw.githubusercontent.com/AAChartModel/Gallery/master/AAChartKit/boxplotChart.png' width="24%">
|
|
<img src='https://raw.githubusercontent.com/AAChartModel/Gallery/master/AAChartKit/MirrorColumnChart.png' width="24%">
|
|
<img src='https://raw.githubusercontent.com/AAChartModel/Gallery/master/AAChartKit/stackingColumnChart.png' width="24%">
|
|
</div>
|
|
|
|
## 安装
|
|
|
|
### JitPack
|
|
|
|
```groovy
|
|
allprojects {
|
|
repositories {
|
|
...
|
|
maven { url 'https://jitpack.io' }
|
|
}
|
|
}
|
|
```
|
|
|
|
```groovy
|
|
dependencies {
|
|
...
|
|
implementation 'com.github.AAChartModel:AAChartCore:-SNAPSHOT'
|
|
}
|
|
```
|
|
|
|
## 使用方法
|
|
|
|
1. 创建视图*AAChartView*
|
|
```xml
|
|
<com.github.AAChartModel.AAChartCore.AAChartCreator.AAChartView
|
|
android:id="@+id/AAChartView"
|
|
android:layout_width="match_parent"
|
|
android:layout_height="match_parent" />
|
|
```
|
|
|
|
```java
|
|
AAChartView aaChartView = findViewById(R.id.AAChartView);
|
|
```
|
|
2. 配置视图模型*AAChartModel*
|
|
|
|
* 链式编程的方式配置 *AAChartModel* 模型对象属性
|
|
```java
|
|
AAChartModel aaChartModel = new AAChartModel()
|
|
.chartType(AAChartType.Area)
|
|
.title("THE HEAT OF PROGRAMMING LANGUAGE")
|
|
.subtitle("Virtual Data")
|
|
.backgroundColor("#4b2b7f")
|
|
.categories(new String[]{"Java", "Swift", "Python", "Ruby", "PHP", "Go", "C", "C#", "C++"})
|
|
.dataLabelsEnabled(false)
|
|
.yAxisGridLineWidth(0f)
|
|
.series(new AASeriesElement[]{
|
|
new AASeriesElement()
|
|
.name("Tokyo")
|
|
.data(new Object[]{7.0, 6.9, 9.5, 14.5, 18.2, 21.5, 25.2, 26.5, 23.3, 18.3, 13.9, 9.6}),
|
|
new AASeriesElement()
|
|
.name("NewYork")
|
|
.data(new Object[]{0.2, 0.8, 5.7, 11.3, 17.0, 22.0, 24.8, 24.1, 20.1, 14.1, 8.6, 2.5}),
|
|
new AASeriesElement()
|
|
.name("London")
|
|
.data(new Object[]{0.9, 0.6, 3.5, 8.4, 13.5, 17.0, 18.6, 17.9, 14.3, 9.0, 3.9, 1.0}),
|
|
new AASeriesElement()
|
|
.name("Berlin")
|
|
.data(new Object[]{3.9, 4.2, 5.7, 8.5, 11.9, 15.2, 17.0, 16.6, 14.2, 10.3, 6.6, 4.8})
|
|
});
|
|
```
|
|
|
|
3. 绘制图形(创建 AAChartView 实例对象后,首次绘制图形调用此方法)
|
|
|
|
```java
|
|
/*图表视图对象调用图表模型对象,绘制最终图形*/
|
|
aaChartView.aa_drawChartWithChartModel(aaChartModel);
|
|
```
|
|
|
|
🌹🌹🌹 好了,至此,有关于绘制图形的任务,一切皆已经搞定!!! 你将得到你想要的任意图形!!!
|
|
|
|
### 更新图形内容
|
|
如果你需要更新图表内容,你应该阅读以下内容,根据你的实际需要,选择调用适合你的函数
|
|
|
|
* 仅仅刷新图形的`series`数据内容(首次绘制图形完成之后,后续刷新图表数据均建议调用此方法)
|
|
|
|
```java
|
|
/*仅仅更新了图表的series数组数据,不改动图表的其他内容*/
|
|
aaChartView.aa_onlyRefreshTheChartDataWithChartModelSeries(chartModelSeriesArray)
|
|
```
|
|
|
|
* 刷新图形除数据属性 `series` 以外的其他属性(首次绘制图形完成之后,后续刷新图表的属性均建议调用此方法 注意:仅仅刷新图形数据,则建议使用上面的👆`aa_onlyRefreshTheChartDataWithChartModelSeries`方法)
|
|
|
|
```java
|
|
/*更新 AAChartModel 整体内容(如修改了图表的类型,将 column chart 改为 area chart)之后,刷新图表*/
|
|
aaChartView.aa_refreshChartWholeContentWithChartModel(aaChartModel)
|
|
```
|
|
|
|
|
|
## **AAChartModel**一些重要属性经过配置之后的图形示例如下
|
|
|
|
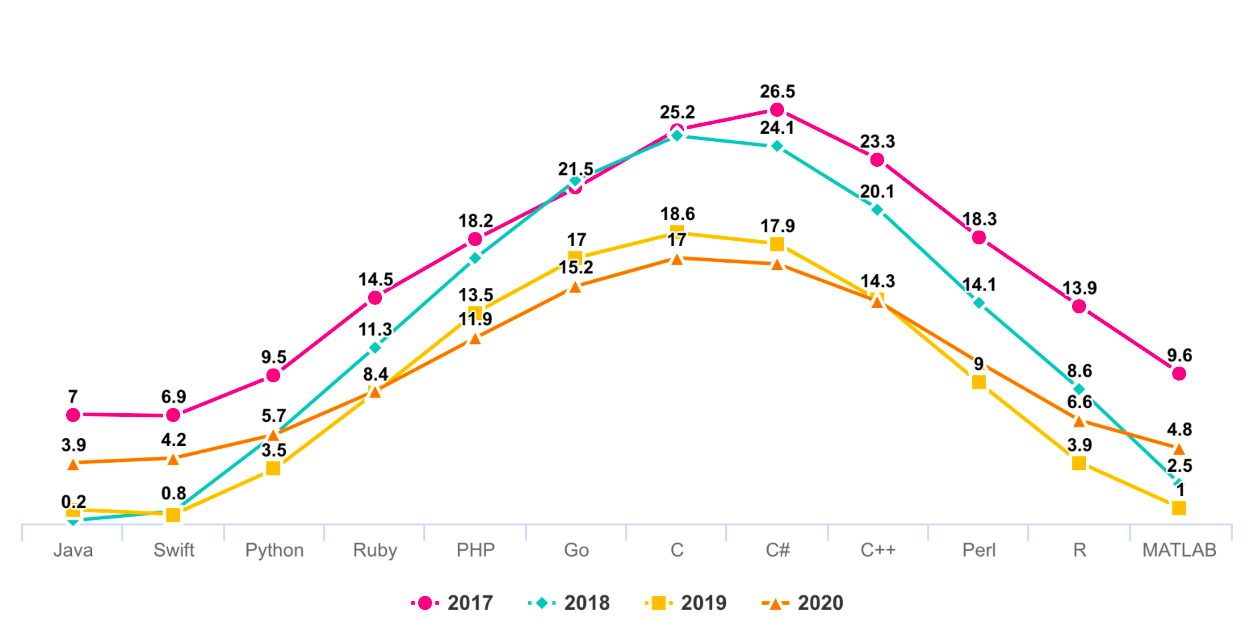
- ### line chart - 折线图
|
|
|
|
|
|
|
|
- ### column chart - 柱形图
|
|
|
|
|
|
|
|
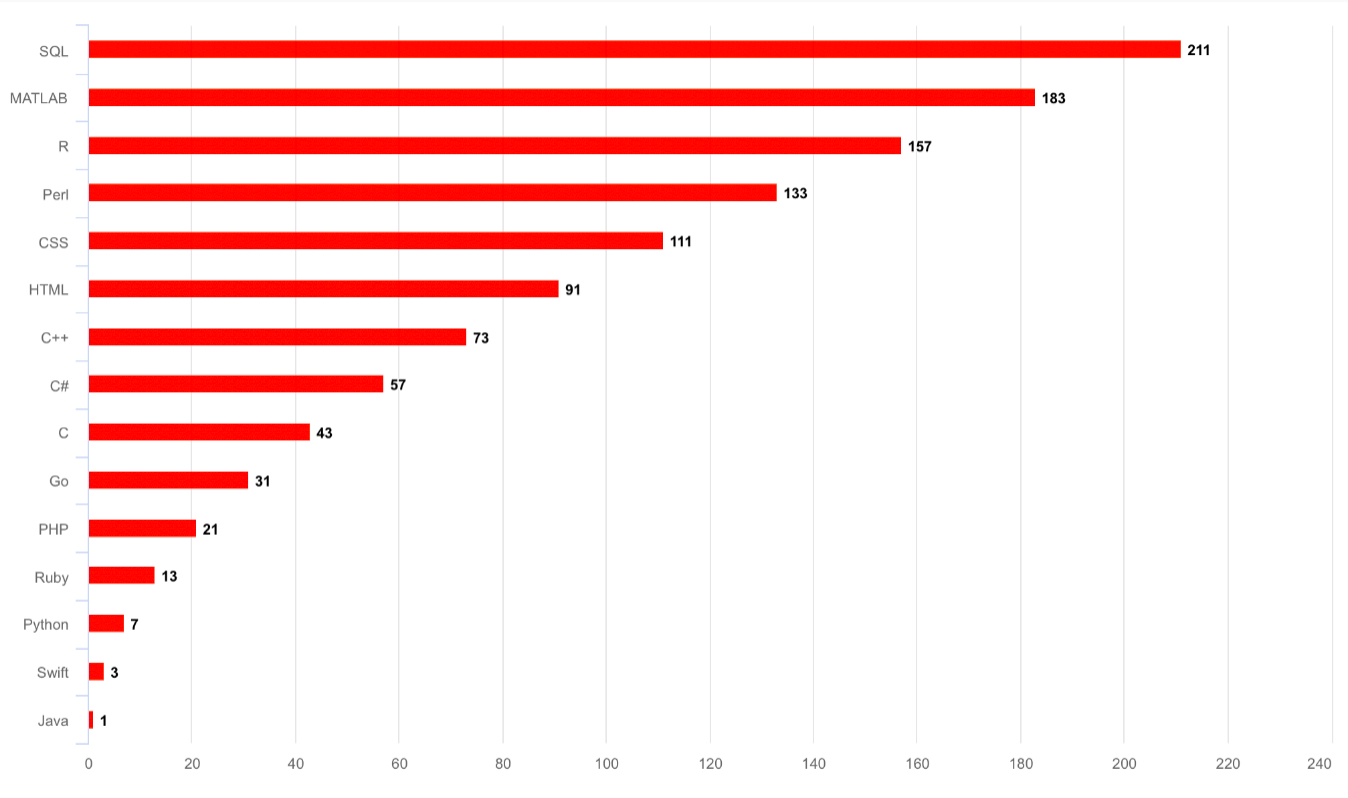
- ### bar chart - 条形图
|
|
|
|
|
|
|
|
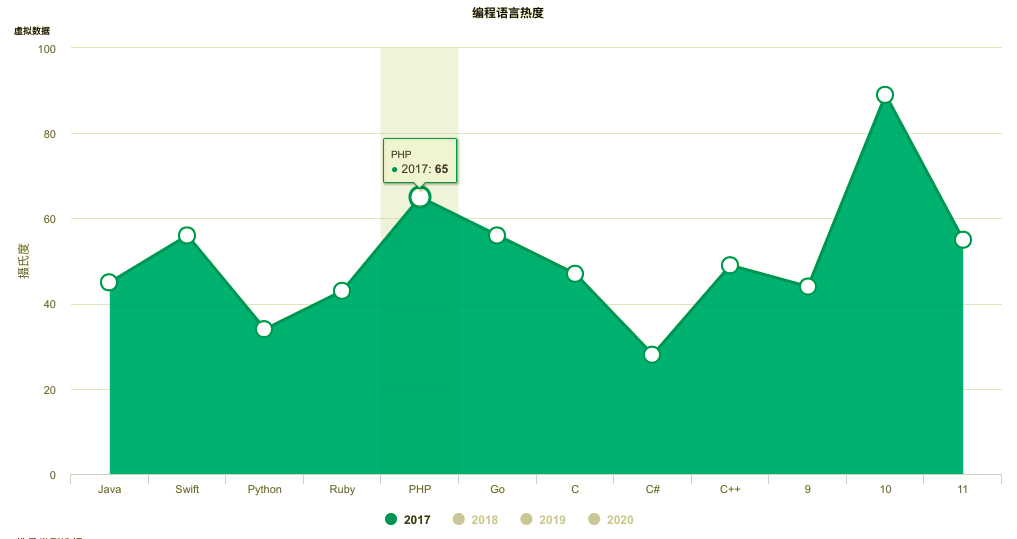
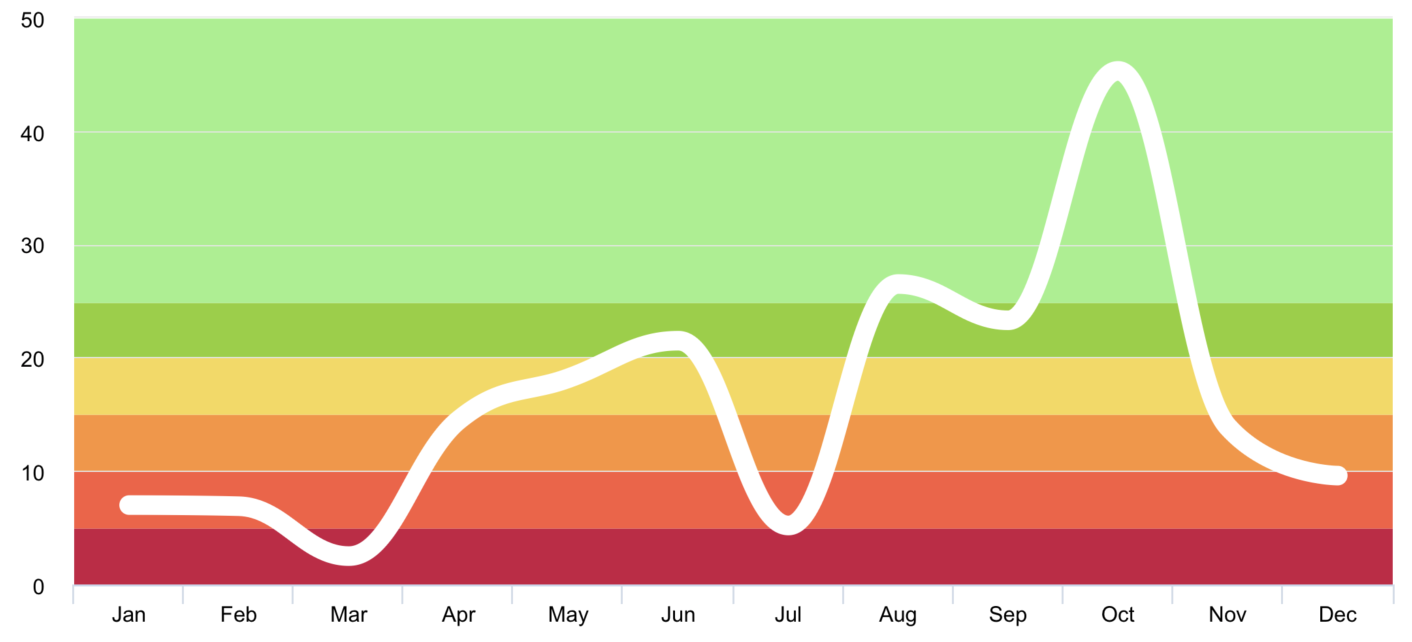
- ### special area chart one - 常规折线区域填充图
|
|
|
|
|
|
|
|
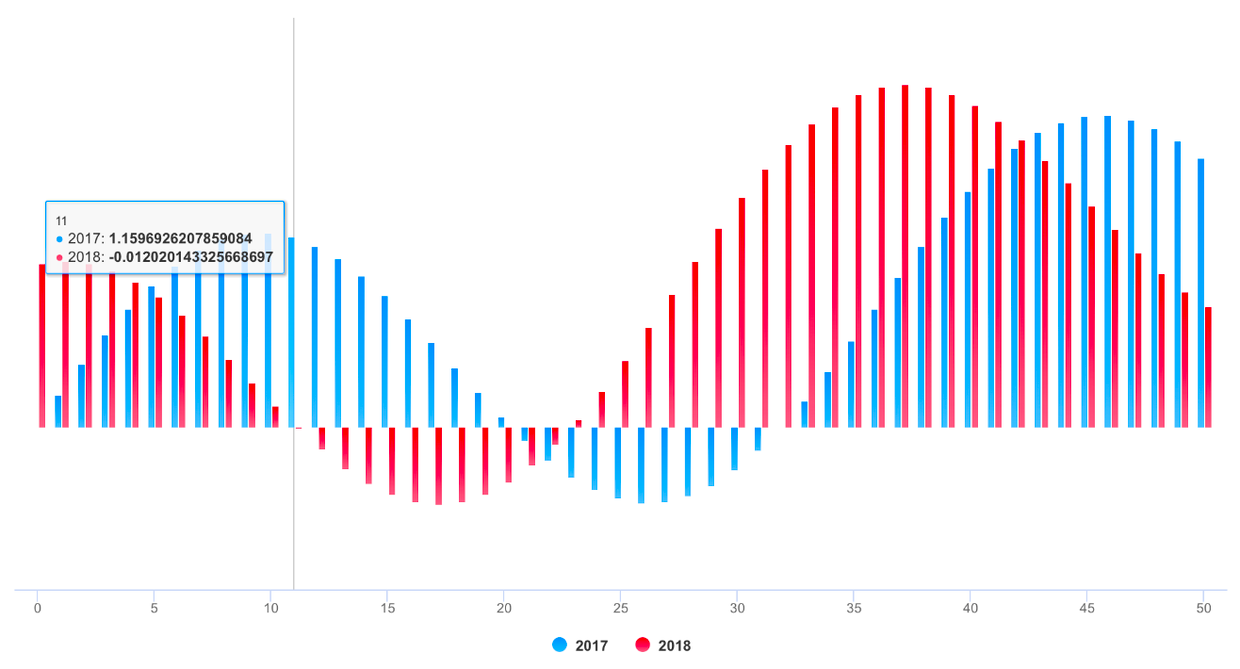
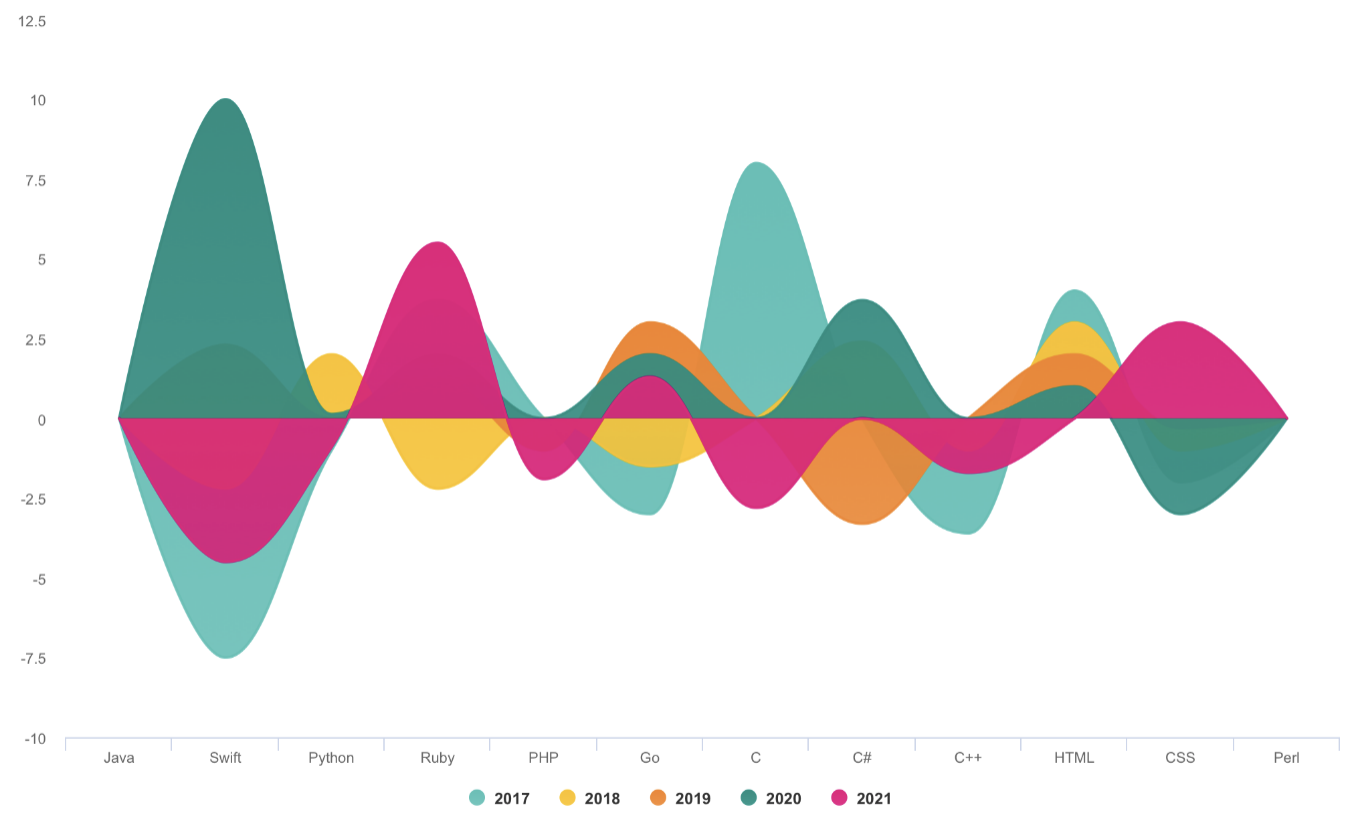
- ### special area chart two - 带有负数的区域填充图
|
|
|
|
)
|
|
|
|
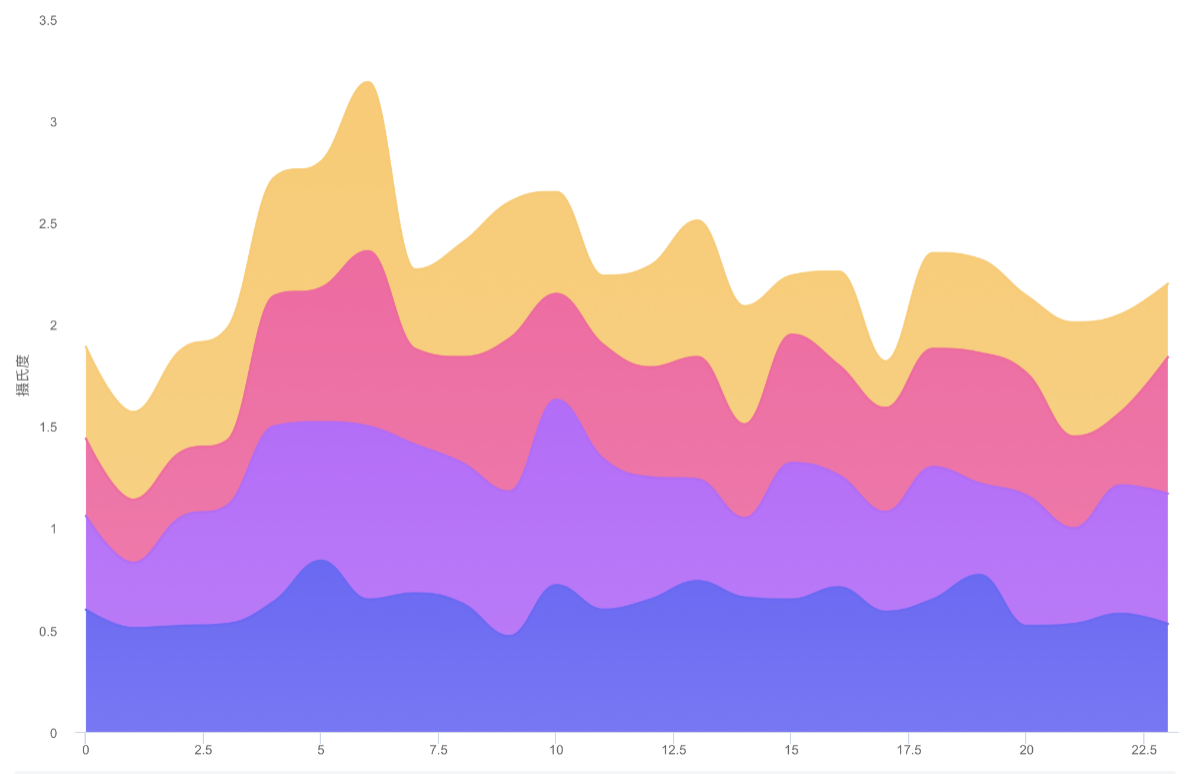
- ### special area chart three - 堆积效果的区域填充图
|
|
|
|
|
|
|
|
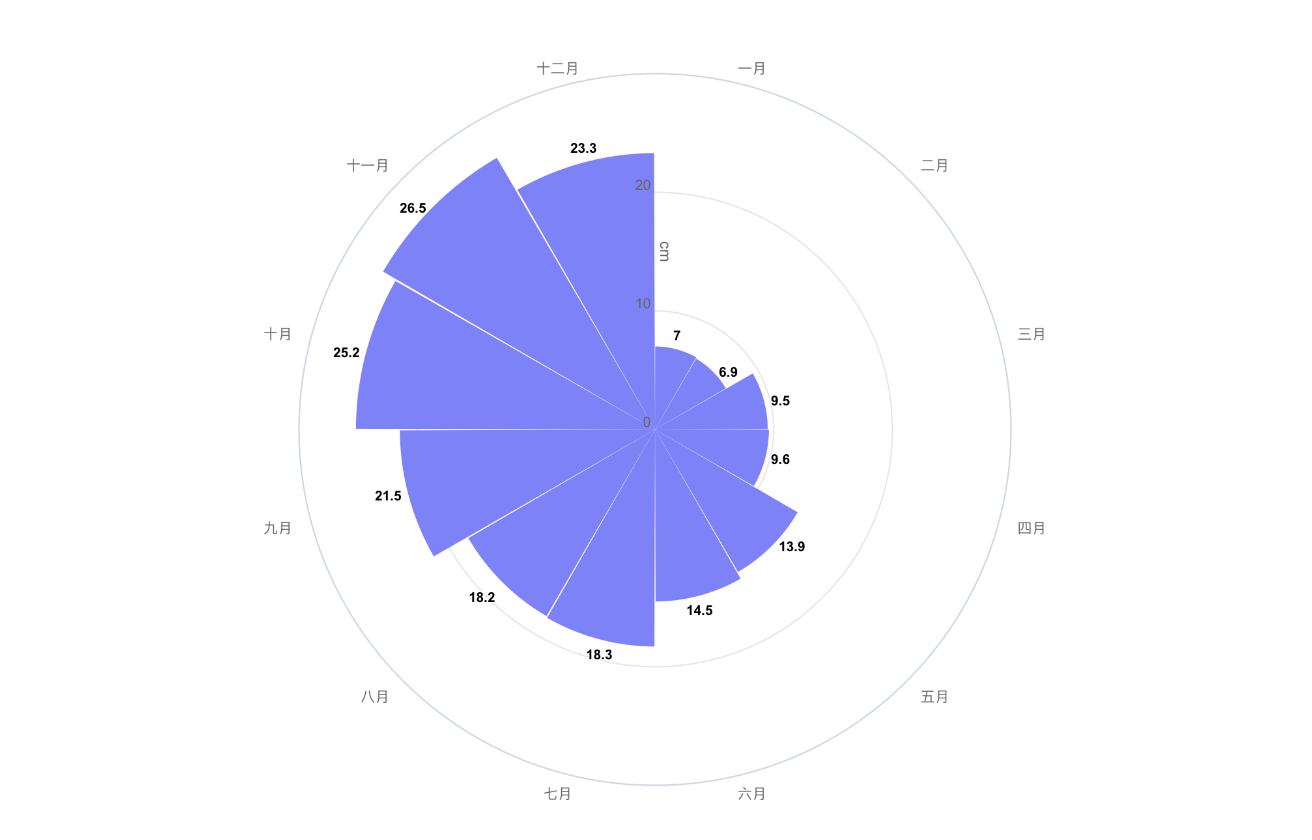
- ### polar chart - 极地图
|
|
|
|
|
|
|
|
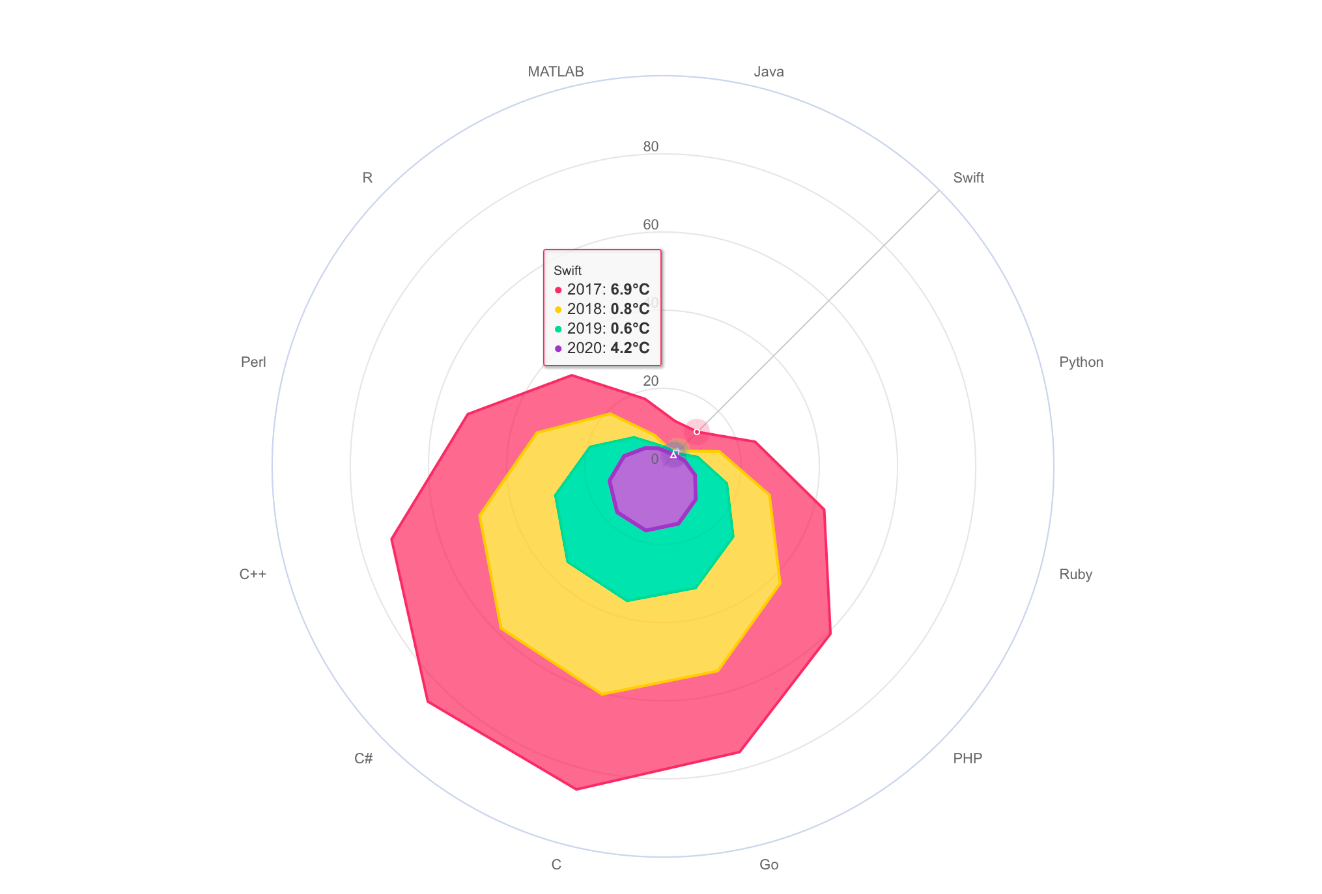
- ### radar chart - 雷达图
|
|
|
|
|
|
|
|
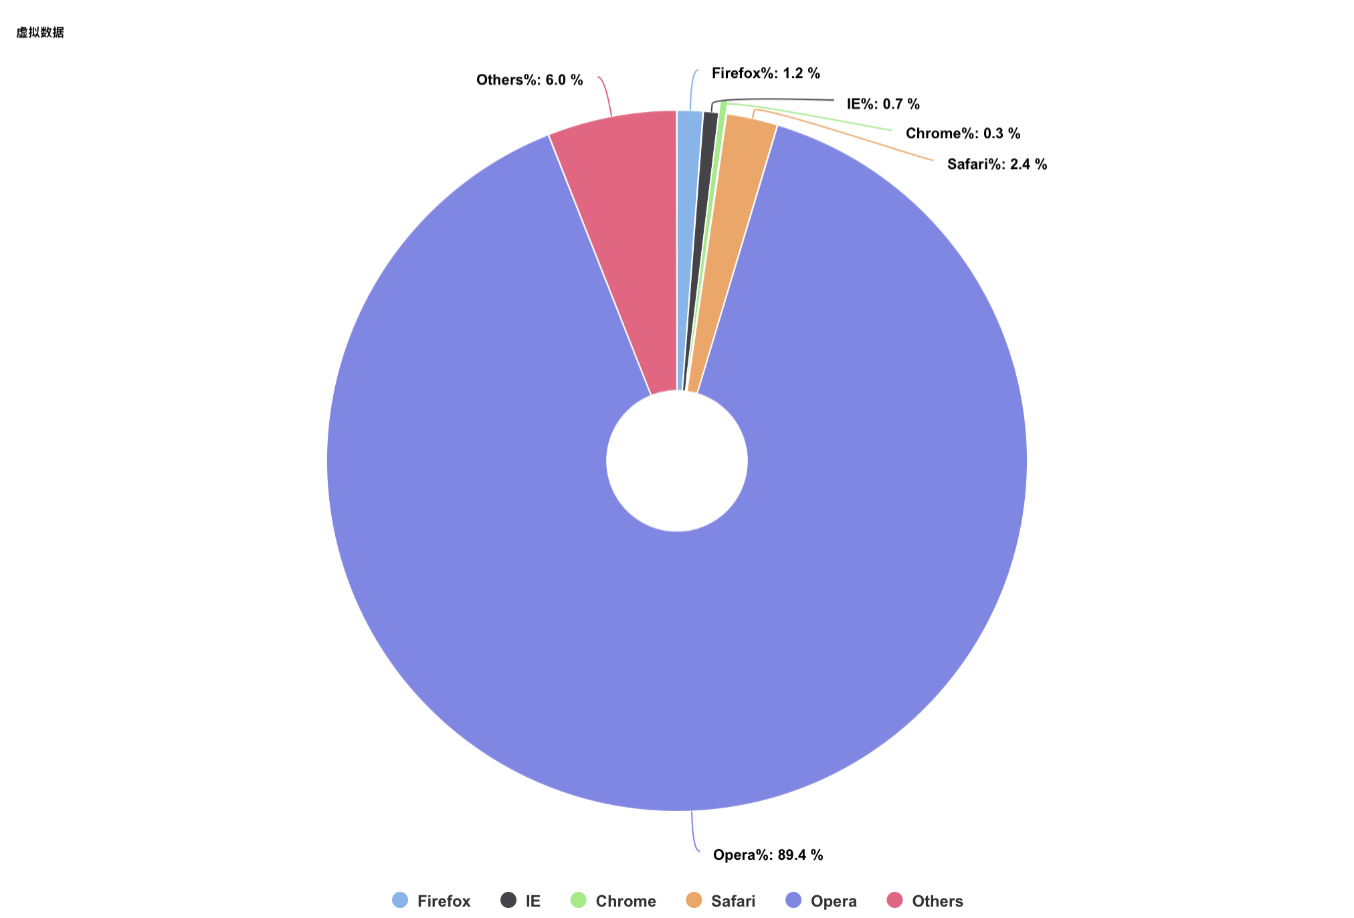
- ### pie chart - 扇形图
|
|
|
|
|
|
|
|
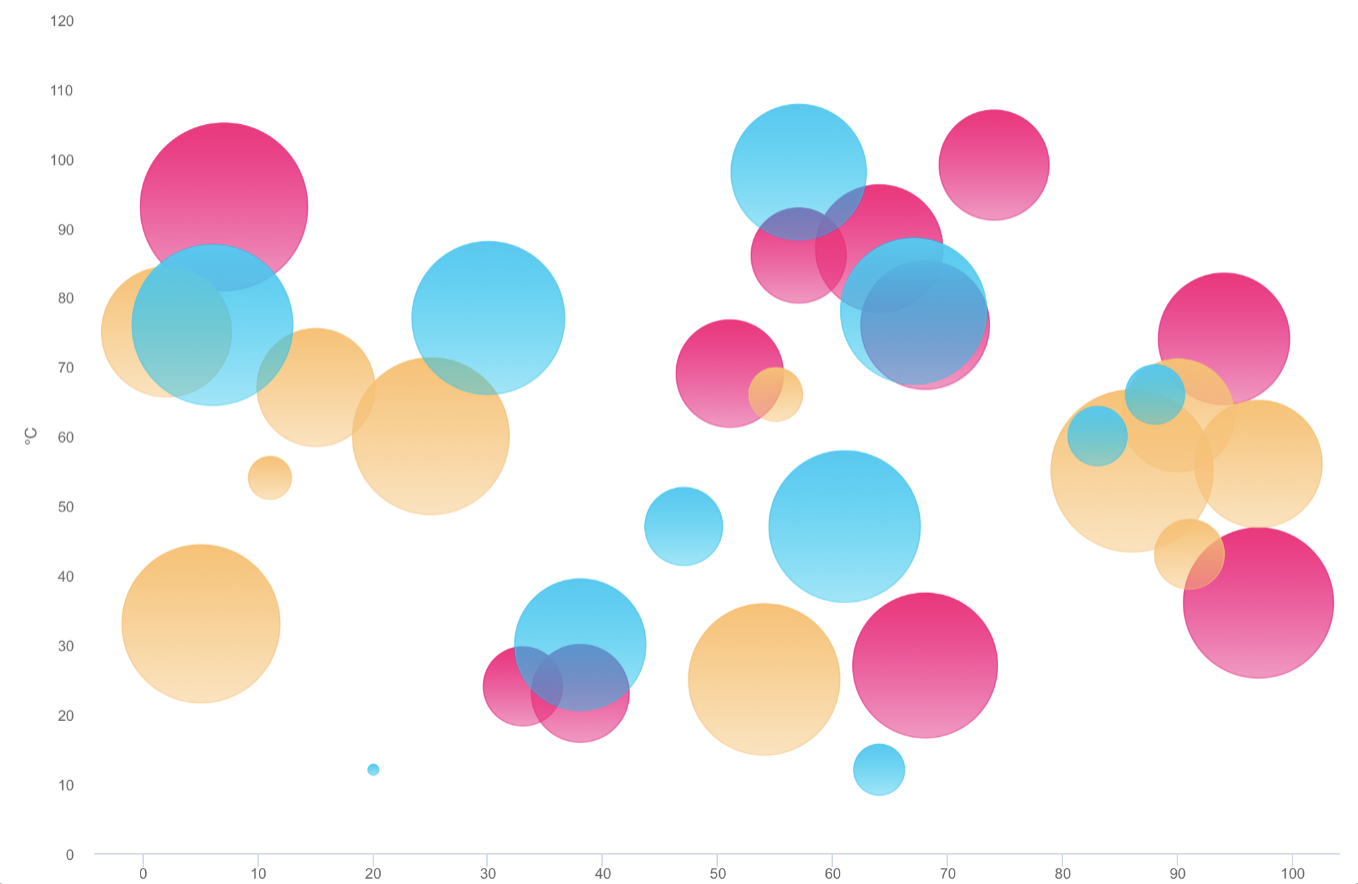
- ### bubble chart - 气泡图
|
|
|
|
|
|
|
|
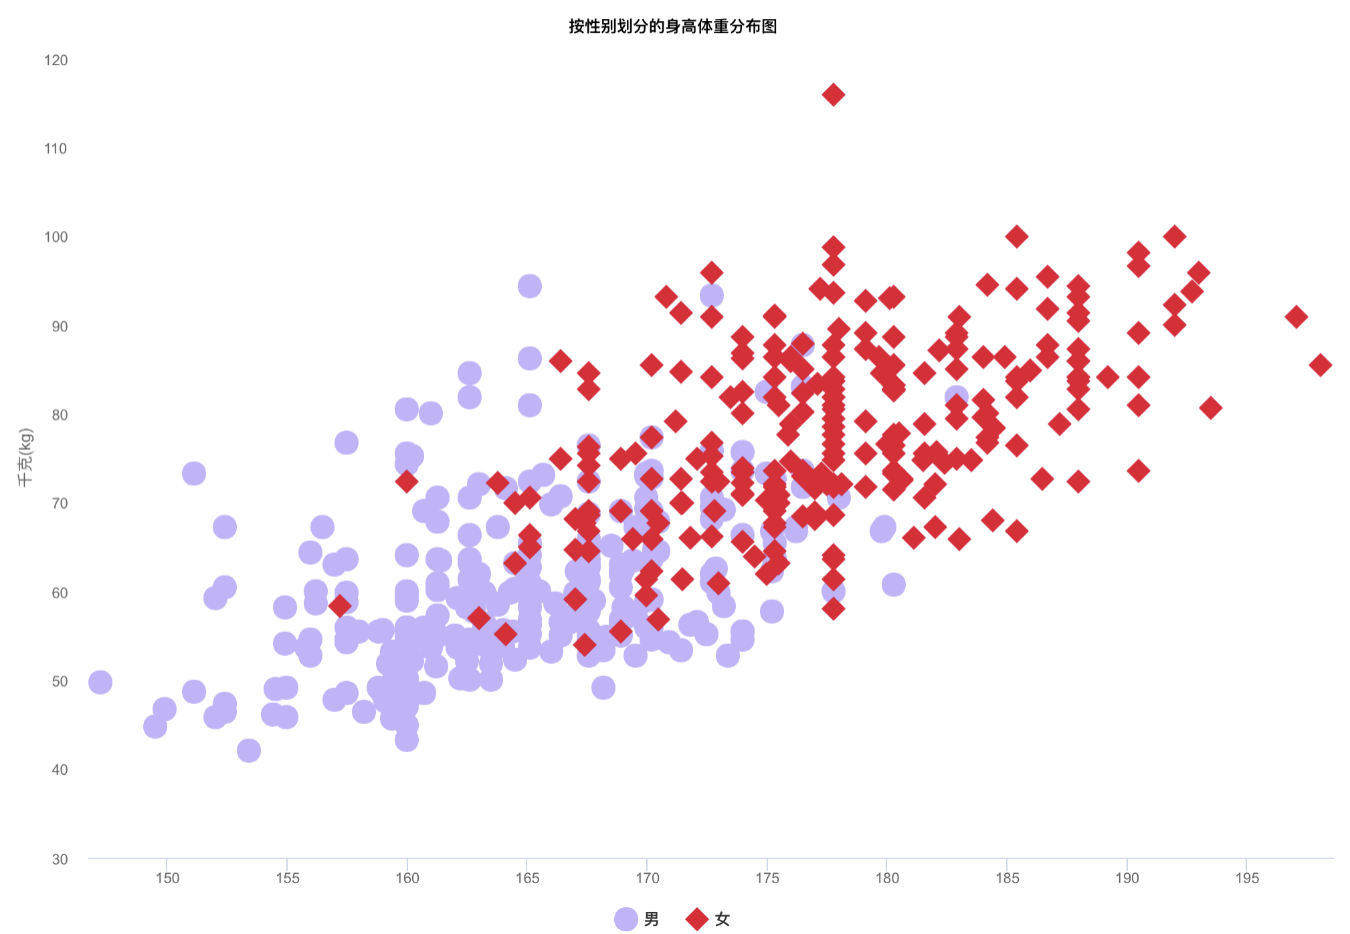
- ### scatter chart - 散点图
|
|
|
|
|
|
|
|
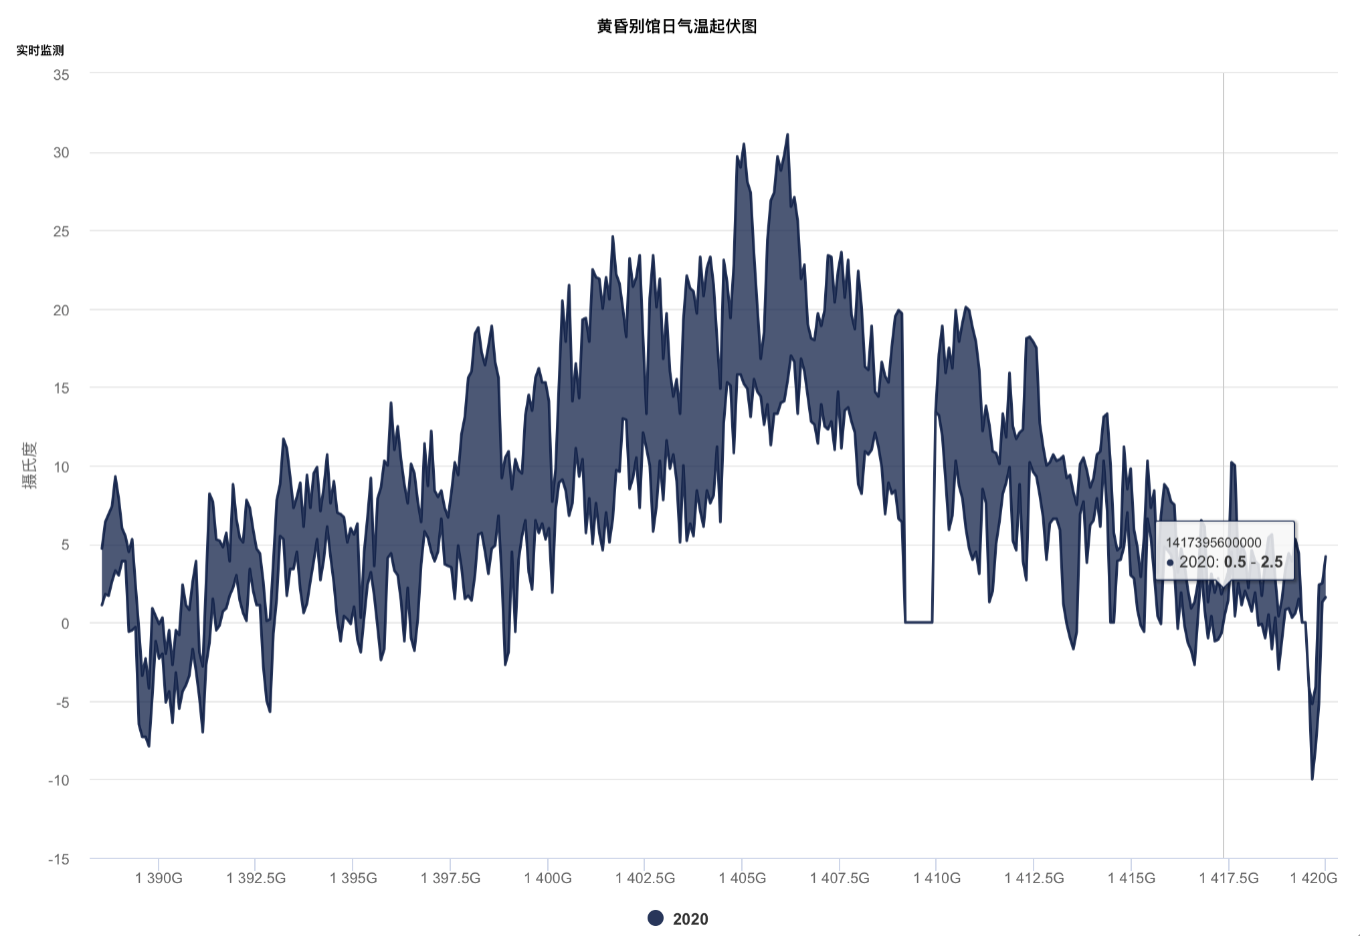
- ### arearange chart - 区域范围图
|
|
|
|
|
|
|
|
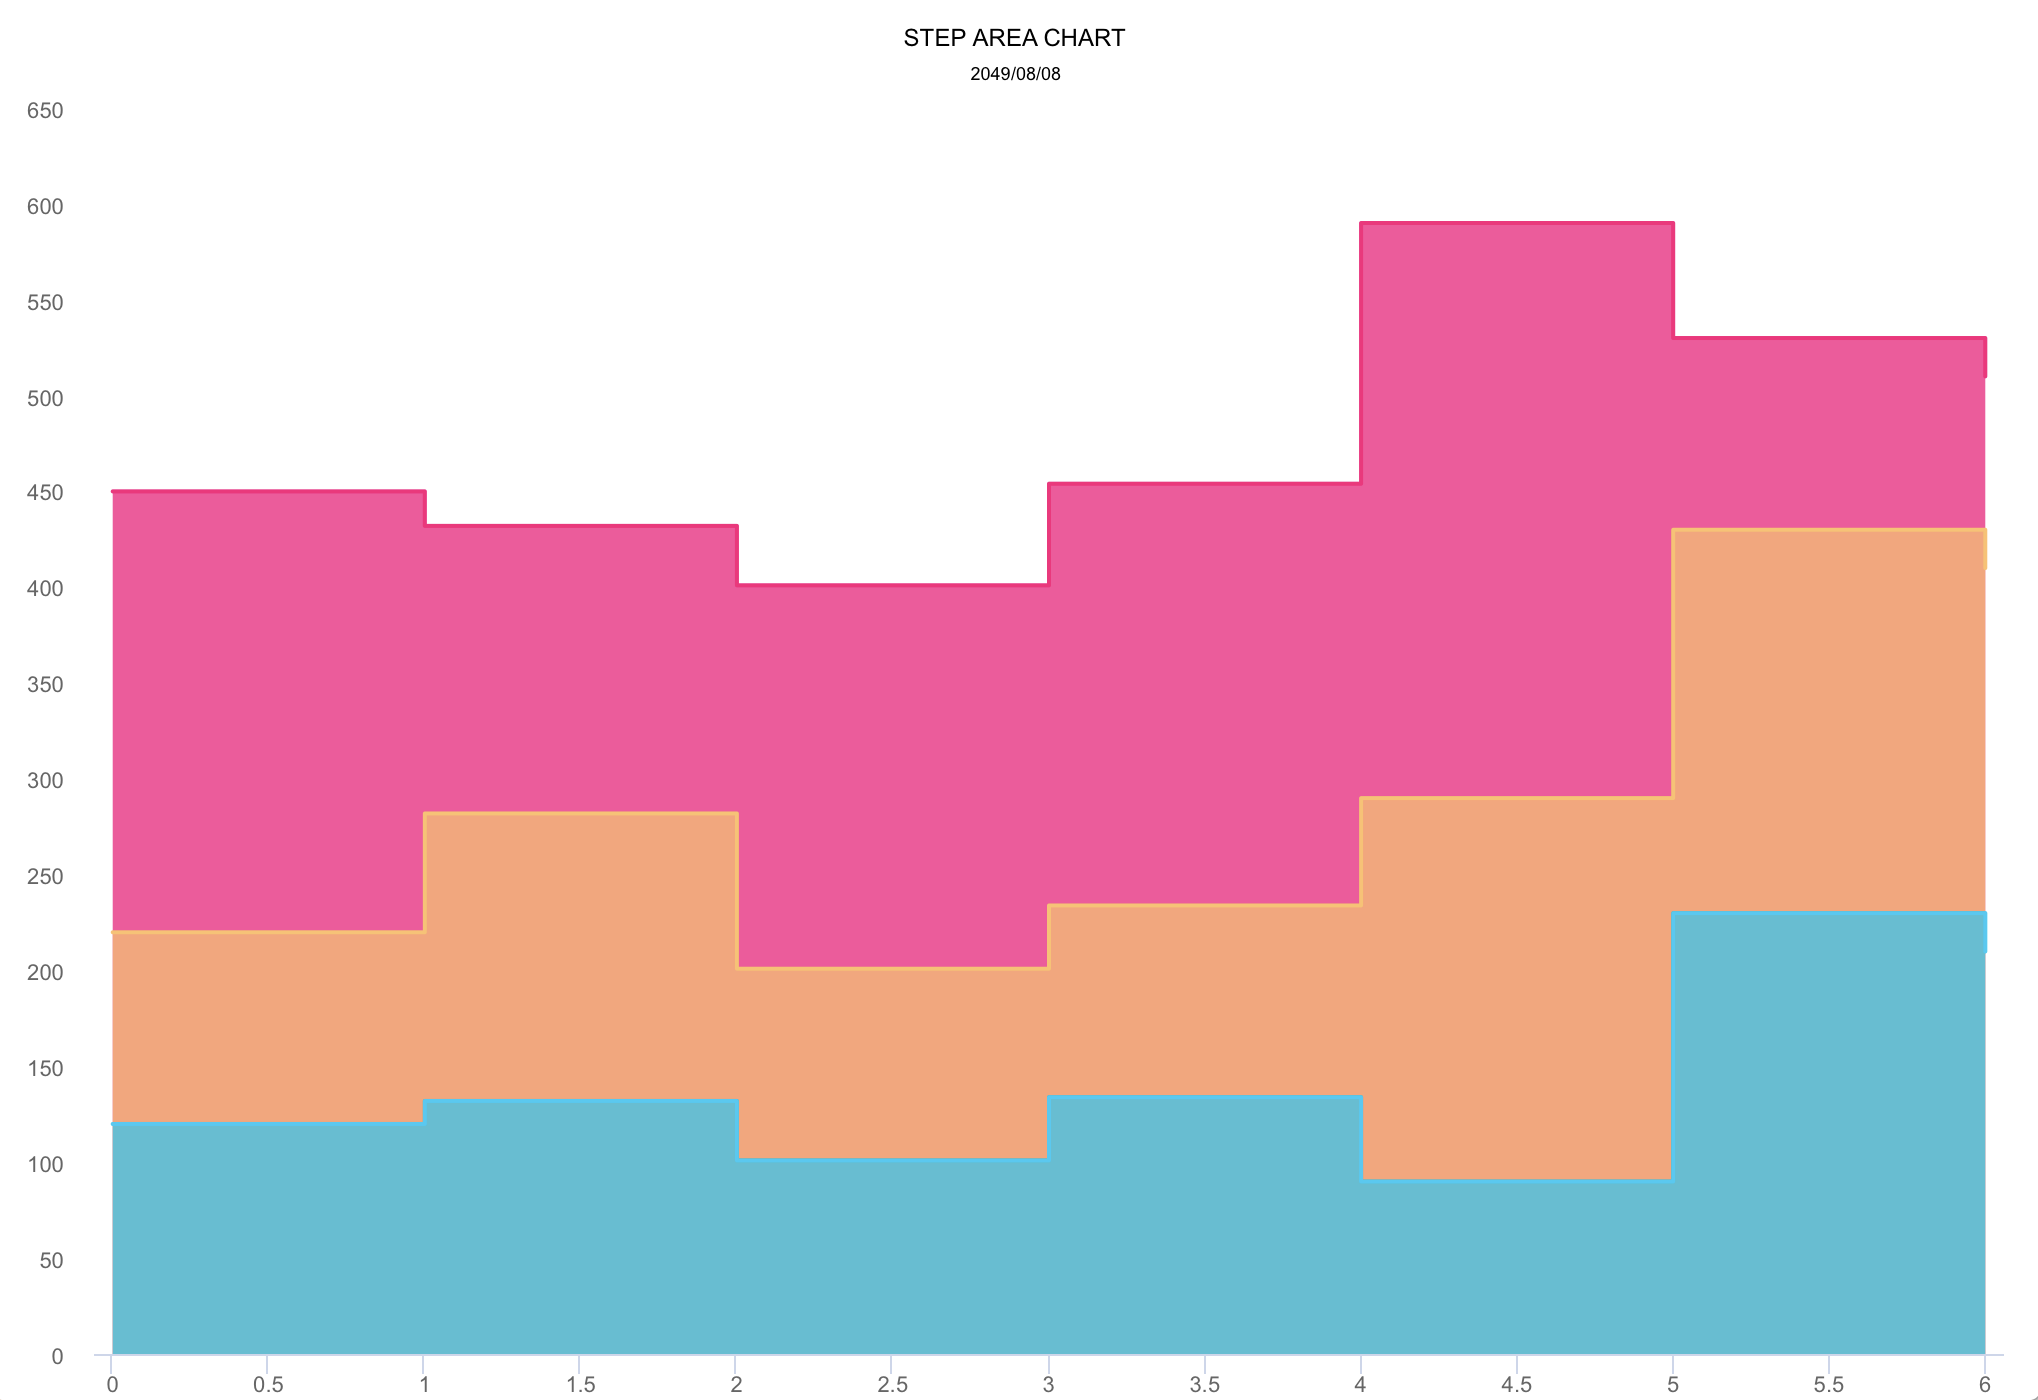
- ### step area chart - 直方折线填充图
|
|
|
|
|
|
|
|
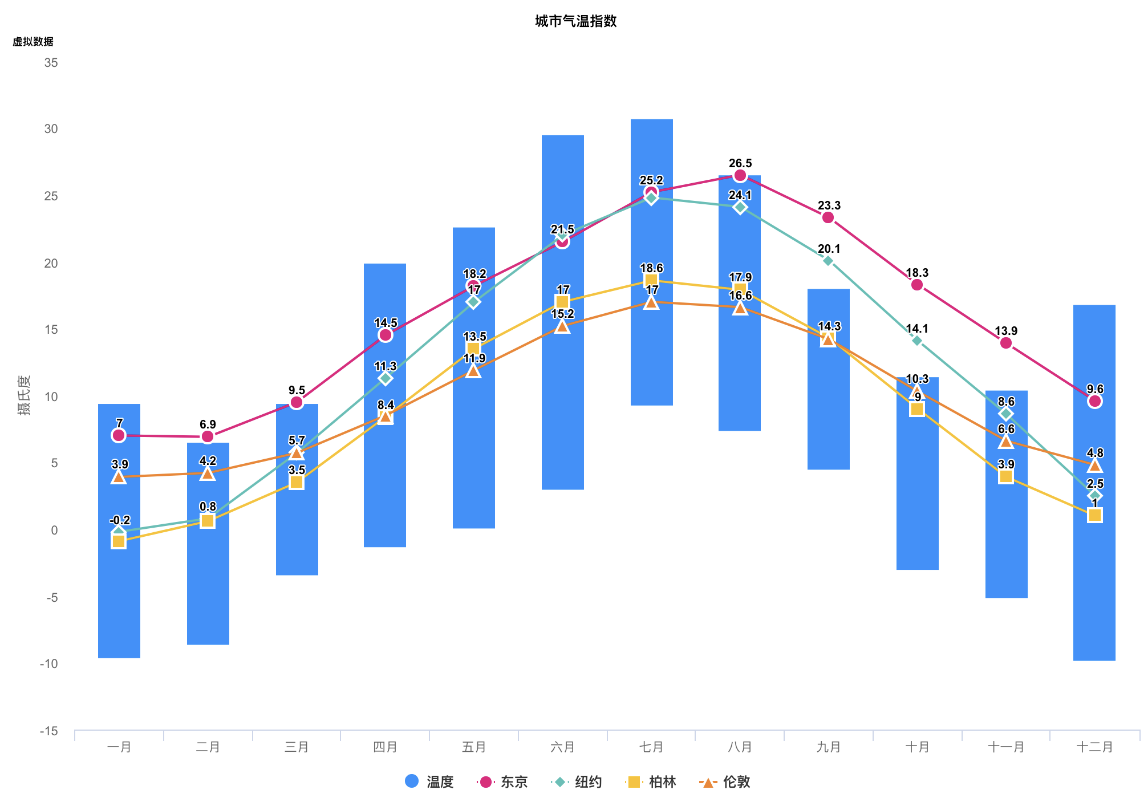
- ### mixed chart - 混合图形
|
|
|
|
|
|
|
|
|
|
### 更多图形效果
|
|
注意:如下的这幅`DEMO演示图`为大小*6M*左右的`GIF动态图`,如未显示动态效果则说明图片资源未全部加载。请耐心等待至图片资源内容完全加载结束后,即可最终观赏更多的项目的动态演示效果.
|
|
|
|
|
|
|
|
|
|
|
|
|
|
## 特别说明
|
|
|
|
### 支持监听用户点击事件及单指滑动事件
|
|
|
|
可通过给 AAChartView 实例对象设置代理方法,来实现监听用户的点击事件和单指滑动事件
|
|
|
|
```java
|
|
public interface AAChartViewCallBack {
|
|
void chartViewMoveOverEventMessage(AAChartView aaChartView, AAMoveOverEventMessageModel messageModel);
|
|
}
|
|
```
|
|
|
|
在监听用户交互事件时,获取的事件信息`AAMoveOverEventMessageModel`共包含以下内容
|
|
|
|
```java
|
|
public class AAMoveOverEventMessageModel {
|
|
public String name;
|
|
public Double x;
|
|
public Double y;
|
|
public String category;
|
|
public LinkedTreeMap offset;
|
|
public Double index;
|
|
}
|
|
```
|
|
|
|
### 支持通过`JavaScript` 函数来自定义 `AATooltip`视图显示效果
|
|
|
|
有时系统默认的 tooltip 浮动提示框的显示效果无法满足使用者的特殊自定义要求,此时可以通过添加 AATooltip 的 `headerFormat`、`footerFormat` 和 `pointFormat` 的字符串属性的`HTML`文本内容,来自定义浮动提示框的显示内容,此三者可以胜任绝大多数情况下的自定义浮动提示框 AATooltip 的任务.
|
|
|
|
如仍旧不能满足需求,更可以通过 AATooltip 的 `formatter` 函数来实现视图的特殊定制化 例如,如下配置 AATooltip 实例对象属性
|
|
|
|
```java
|
|
AATooltip aaTooltip = new AATooltip()
|
|
.useHTML(true)
|
|
.formatter(" function () {\n" +
|
|
" return ' 🌕 🌖 🌗 🌘 🌑 🌒 🌓 🌔 <br/> '\n" +
|
|
" + ' Support JavaScript Function Just Right Now !!! <br/> '\n" +
|
|
" + ' The Gold Price For <b>2020 '\n" +
|
|
" + this.x\n" +
|
|
" + ' </b> Is <b> '\n" +
|
|
" + this.y\n" +
|
|
" + ' </b> Dollars ';\n" +
|
|
" }")
|
|
.valueDecimals(2)//设置取值精确到小数点后几位//设置取值精确到小数点后几位
|
|
.backgroundColor("#000000")
|
|
.borderColor("#000000")
|
|
.style(new AAStyle()
|
|
.color("#FFD700")
|
|
.fontSize("12 px")
|
|
);
|
|
```
|
|
即可完成图表的浮动提示框的特殊定制化.得到的自定义浮动提示框的视觉效果图如下👇
|
|

|
|
|
|
### 支持添加值域分割功能⚔
|
|
|
|
* 添加值域分割颜色带 `plotBands 🎀`
|
|
|
|
|
|
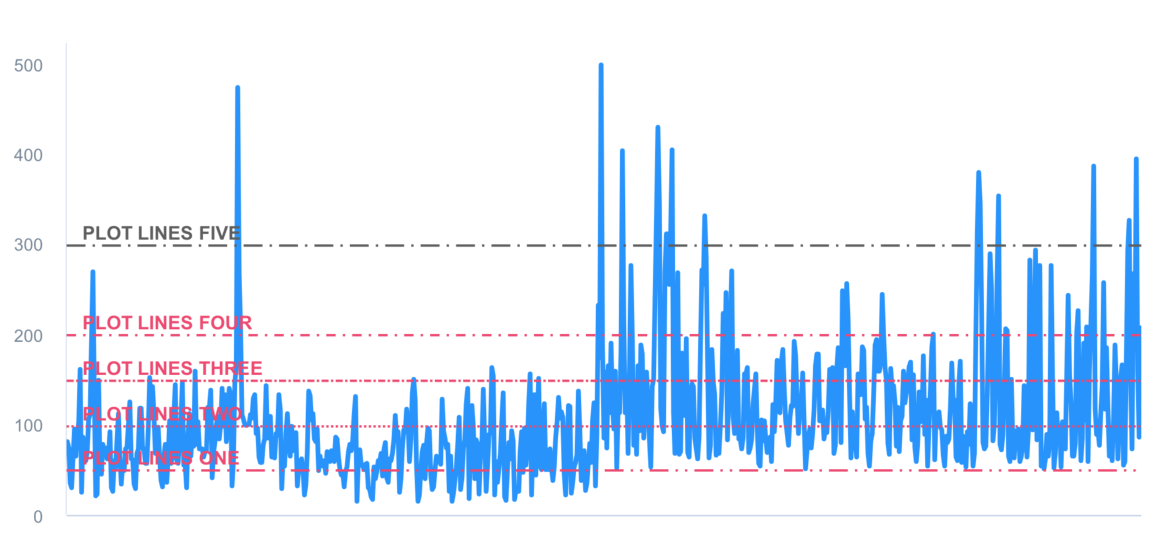
* 添加值域分割颜色线 `plotLines 🧶`
|
|
|
|
|
|
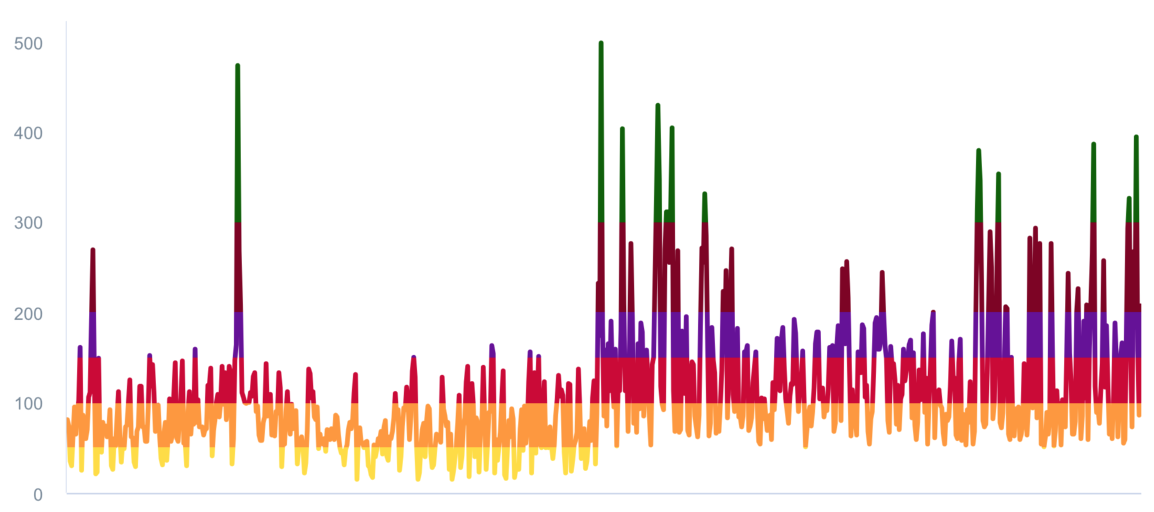
* 添加值域分割数据列分区 `zones 🧱`
|
|
|
|
|
|
|
|
### 支持图表数据的动态滚动刷新
|
|
|
|
<div >
|
|
<img src='https://raw.githubusercontent.com/AAChartModel/Gallery/master/AAChartKit/scrollingUpdateColumnChart.gif' >
|
|
<img src='https://raw.githubusercontent.com/AAChartModel/Gallery/master/AAChartKit/scrollingUpdateLineChart.gif' >
|
|
<img src='https://raw.githubusercontent.com/AAChartModel/Gallery/master/AAChartKit/scrollingUpdateStepAreaChart.gif' >
|
|
</div>
|
|
|
|
### 支持图表数据的动态排序
|
|
|
|
<div >
|
|
<img src='https://raw.githubusercontent.com/AAChartModel/Gallery/master/AAChartKit/DataSortingColumnChart.gif' >
|
|
<img src='https://raw.githubusercontent.com/AAChartModel/Gallery/master/AAChartKit/DataSortingScatterChart.gif' >
|
|
<img src='https://raw.githubusercontent.com/AAChartModel/Gallery/master/AAChartKit/DataSortingBarChart.gif' >
|
|
</div>
|
|
|
|
### 当前已支持的图表类型有十种以上,说明如下
|
|
|
|
```java
|
|
public interface AAChartType {
|
|
String Column = "column";
|
|
String Bar = "bar";
|
|
String Area = "area";
|
|
String AreaSpline = "areaspline";
|
|
String Line = "line";
|
|
String Spline = "spline";
|
|
String Scatter = "scatter";
|
|
String Pie = "pie";
|
|
String Bubble = "bubble";
|
|
String Pyramid = "pyramid";
|
|
String Funnel = "funnel";
|
|
String Columnrange = "columnrange";
|
|
String Arearange = "arearange";
|
|
String Areasplinerange = "areasplinerange";
|
|
String Boxplot = "boxplot";
|
|
String Waterfall = "waterfall";
|
|
}
|
|
```
|
|
|
|
### 当前已支持的图表手势缩放类型共有三种,说明如下
|
|
|
|
```java
|
|
public interface AAChartZoomType {
|
|
String None = "none"; //禁用图表手势缩放功能(默认禁用手势缩放)
|
|
String X = "x"; //支持图表 X 轴横向缩放
|
|
String Y = "y"; //支持图表 Y 轴纵向缩放X
|
|
String XY = "xy"; //支持图表 XY 轴纵向缩放
|
|
}
|
|
```
|
|
|
|
NOTE:例如,设置了`AAChartModel`的缩放属性`zoomType`为`AAChartZoomType.X`,并且将图表进行了手势放大之后,这时候如果想要左右滑动图表,可以使用 **双指点按** 屏幕中的`AAChartView`视图区域进行 **左右拖动** 即可.同时屏幕的右上角会自动出现一个标题为 **"恢复缩放"** 的按钮,点击恢复缩放,图表大小和位置将会回归到原初的样式.
|
|
|
|
### 当前已支持的图表渲染动画类型有三十种以上,说明如下
|
|
|
|
```java
|
|
public interface AAChartAnimationType {
|
|
String EaseInQuad = "easeInQuad";
|
|
String EaseOutQuad = "easeOutQuad";
|
|
String EaseInOutQuad = "easeInOutQuad";
|
|
String EaseInCubic = "easeInCubic";
|
|
String EaseOutCubic = "easeOutCubic";
|
|
String EaseInOutCubic = "easeInOutCubic";
|
|
String EaseInQuart = "easeInQuart";
|
|
String EaseOutQuart = "easeOutQuart";
|
|
String EaseInOutQuart = "easeInOutQuart";
|
|
String EaseInQuint = "easeInQuint";
|
|
String EaseOutQuint = "easeOutQuint";
|
|
String EaseInOutQuint = "easeInOutQuint";
|
|
String EaseInSine = "easeInSine";
|
|
String EaseOutSine = "easeOutSine";
|
|
String EaseInOutSine = "easeInOutSine";
|
|
String EaseInExpo = "easeInExpo";
|
|
String EaseOutExpo = "easeOutExpo";
|
|
String EaseInOutExpo = "easeInOutExpo";
|
|
String EaseInCirc = "easeInCirc";
|
|
String EaseOutCirc = "easeOutCirc";
|
|
String EaseInOutCirc = "easeInOutCirc";
|
|
String EaseOutBounce = "easeOutBounce";
|
|
String EaseInBack = "easeInBack";
|
|
String EaseOutBack = "easeOutBack";
|
|
String EaseInOutBack = "easeInOutBack";
|
|
String Elastic = "elastic";
|
|
String SwingFromTo = "swingFromTo";
|
|
String SwingFrom = "swingFrom";
|
|
String SwingTo = "swingTo";
|
|
String Bounce = "bounce";
|
|
String BouncePast = "bouncePast";
|
|
String EaseFromTo = "easeFromTo";
|
|
String EaseFrom = "easeFrom";
|
|
String EaseTo = "easeTo";
|
|
}
|
|
```
|
|
|
|
以下是**ChartCore-Slim**其中十种图表渲染动画类型
|
|
|
|
| Back | Bounce | Circ | Cubic | Elastic |
|
|
|:---------:|:---------:|:---------:|:---------:|:---------:|
|
|
| ![][1] | ![][2] | ![][3] | ![][4] | ![][5] |
|
|
|
|
|
|
| Expo | Quad | Quart | Quint | Sine |
|
|
|:---------:|:---------:|:---------:|:---------:|:---------:|
|
|
| ![][6] | ![][7] | ![][8] | ![][9] | ![][10] |
|
|
|
|
|
|
## 关于`AAChartModel` 属性说明
|
|
|
|
* ### AAChartModel 主要属性说明
|
|
|
|
属性名称 | 描述 | 取值范围 |
|
|
------------ |------------- | ------------- |
|
|
title | 图表主标题 | 任意有效的字符串 |
|
|
subtitle | 图表副标题 | 任意有效的字符串 |
|
|
chartType | 图表类型,可以为`AAChartType`枚举字符串当中指定的任意有效类型.其中有支持`柱状图` 、`条形图` 、`折线图` 、`曲线图` 、`折线填充图` 、`曲线填充图`、`雷达图`、`扇形图`、`气泡图`、`散点图`、`金字塔图`、`漏斗图`、`区域范围图`、`柱形范围图`等多种图形 | .column, .bar, .area, .areaSpline, .line, .spline, .pie, .bubble, .scatter, .pyramid, .funnel, .areaRange, .columnRange |
|
|
stacking| 是否将图表每个数据列的值叠加在一起。 默认的值为`.none`, 即禁用堆叠样式效果.另有常规堆叠样式和百分比堆叠样式可供选择 | .none, .normal, .percent |
|
|
symbol | 图表曲线连接点的样式类型.其可供选择的值有`圆`、`正方形`、`钻石`、`常规三角形`和`倒三角形`,默认为混合样式 | .circle, .square, .diamond, .triangle, .triangleDown |
|
|
colorsTheme | 图表显示的颜色主题效果 |类似此 `new String[]{"#fe117c","#ffc069","#06caf4","#7dffc0"}` 有效十六进制颜色字符串数组 |
|
|
series | 图表的数据列 | AASeriesElement实例对象组成的有效数组,其中每个AASeriesElement都有与之对应的数据、类型、颜色、透明度等具体的值 |
|
|
|
|
|
|
* ### AAChartModel 所有属性列表说明
|
|
```java
|
|
public String animationType; //动画类型
|
|
public Integer animationDuration; //动画时间
|
|
public String title; //标题内容
|
|
public String subtitle; //副标题内容
|
|
public String chartType; //图表类型
|
|
public String stacking; //堆积样式
|
|
public String symbol; //折线曲线连接点的类型:"circle", "square", "diamond", "triangle","triangle-down",默认是"circle"
|
|
public String symbolStyle;
|
|
public String zoomType; //缩放类型 AAChartZoomTypeX表示可沿着 x 轴进行手势缩放
|
|
public Boolean pointHollow; //折线或者曲线的连接点是否为空心的
|
|
public Boolean inverted; //x 轴是否翻转(垂直)
|
|
public Boolean xAxisReversed; //x 轴翻转
|
|
public Boolean yAxisReversed; //y 轴翻转
|
|
public Boolean tooltipEnabled; //是否显示浮动提示框(默认显示)
|
|
public String tooltipValueSuffix; //浮动提示框单位后缀
|
|
public Boolean tooltipCrosshairs; //是否显示准星线(默认显示)
|
|
public Boolean gradientColorEnable; //是否要为渐变色
|
|
public Boolean polar; //是否极化图形(变为雷达图)
|
|
public Float marginLeft;
|
|
public Float marginRight;
|
|
public Boolean dataLabelEnabled; //是否显示数据
|
|
public Boolean xAxisLabelsEnabled; //x轴是否显示数据
|
|
public String[]categories; //x轴是否显示数据
|
|
public Integer xAxisGridLineWidth; //x轴网格线的宽度
|
|
public Boolean xAxisVisible; //x 轴是否显示
|
|
public Boolean yAxisVisible; //y 轴是否显示
|
|
public Boolean yAxisLabelsEnabled; //y轴是否显示数据
|
|
public String yAxisTitle; //y轴标题
|
|
public Float yAxisLineWidth; //y 轴轴线的宽度
|
|
|
|
public Integer yAxisGridLineWidth; //y轴网格线的宽度
|
|
public Object[]colorsTheme; //图表主题颜色数组
|
|
public Boolean legendEnabled; //是否显示图例
|
|
public String legendLayout; //图例数据项的布局。布局类型: "horizontal" 或 "vertical" 即水平布局和垂直布局 默认是:horizontal.
|
|
public String legendAlign; //设定图例在图表区中的水平对齐方式,合法值有left,center 和 right。
|
|
public String legendVerticalAlign; //设定图例在图表区中的垂直对齐方式,合法值有 top,middle 和 bottom。垂直位置可以通过 y 选项做进一步设定。
|
|
public String backgroundColor; //图表背景色
|
|
public Boolean options3dEnable; //是否3D化图形(仅对条形图,柱状图有效)
|
|
public Integer options3dAlphaInt;
|
|
public Integer options3dBetaInt;
|
|
public Integer options3dDepth; //3D图形深度
|
|
public Integer borderRadius; //柱状图长条图头部圆角半径(可用于设置头部的形状,仅对条形图,柱状图有效)
|
|
public Integer markerRadius; //折线连接点的半径长度
|
|
public AASeriesElement[] series;
|
|
public String titleColor; //标题颜色
|
|
public String subTitleColor; //副标题颜色
|
|
public String axisColor; //x 轴和 y 轴文字颜色
|
|
```
|
|
|
|
|
|
## 作者
|
|
|
|
An An
|
|
```java
|
|
|
|
_oo0oo_
|
|
o8888888o
|
|
88" . "88
|
|
(| -_- |)
|
|
0\ = /0
|
|
___/`---'\___
|
|
.' \\| |// '.
|
|
/ \\||| : |||// \
|
|
/ _||||| -:- |||||- \
|
|
| | \\\ - /// | |
|
|
| \_| ''\---/'' |_/ |
|
|
\ .-\__ '-' ___/-. /
|
|
___'. .' /--.--\ `. .'___
|
|
."" '< `.___\_<|>_/___.' >' "".
|
|
| | : `- \`.;`\ _ /`;.`/ - ` : | |
|
|
\ \ `_. \_ __\ /__ _/ .-` / /
|
|
=====`-.____`.___ \_____/___.-`___.-'=====
|
|
`=---='
|
|
*******************************************************
|
|
¥¥¥¥¥¥¥¥¥¥¥¥¥¥¥¥¥¥¥¥¥¥¥¥¥¥¥¥¥¥¥¥¥¥¥¥¥¥¥¥¥¥¥
|
|
€€€€€€€€€€€€€€€€€€€€€€€€€€€€€€€€€€
|
|
$$$$$$$$$$$$$$$$$$$$$$$
|
|
BUDDHA_BLESS_YOU
|
|
AWAY_FROM
|
|
BUG
|
|
|
|
```
|
|
|
|
## 源代码⛓
|
|
语言版本 | 项目名称 | 适用平台| 源代码链接|
|
|
------------ | ------------- |------------- | ------------- |
|
|
Kotlin | AAInfographics | Android | https://github.com/AAChartModel/AAChartCore-Kotlin |
|
|
Java | AAChartCore | Android | https://github.com/AAChartModel/AAChartCore |
|
|
Swift | AAInfographics | iOS |https://github.com/AAChartModel/AAChartKit-Swift |
|
|
Objective C | AAChartKit | iOS | https://github.com/AAChartModel/AAChartKit |
|
|
Dart | AACharts-Flutter | iOS/Android | https://github.com/AAChartModel/AACharts-Flutter |
|
|
C# | AACharts-Xamarin | iOS/Android | https://github.com/AAChartModel/AACharts-Xamarin |
|
|
|
|
|
|
## 许可证
|
|
|
|

|
|
|
|
本项目 `AAChartCore`使用 MIT许可证,详情请点击[MIT LICENSE](https://github.com/AAChartModel/AAChartKit-Swift/blob/master/LICENSE)
|
|
|
|
## 联系方式
|
|
|
|
-------------------------------------------------------------------------------
|
|
* 🌕 🌖 🌗 🌘 暖心提示 🌑 🌒 🌓 🌔
|
|
*
|
|
* 如果有任何使用上的问题,随时欢迎您在 GitHub 上向我提 issue.
|
|
* GitHub Issues : https://github.com/AAChartModel/AAChartCore/issues
|
|
-------------------------------------------------------------------------------
|
|
* 如果您想参与到此项目的开源活动中来,也同样随时欢迎您联系我
|
|
* GitHub : https://github.com/AAChartModel
|
|
* StackOverflow : https://stackoverflow.com/users/7842508/codeforu
|
|
* JianShu : http://www.jianshu.com/u/f1e6753d4254
|
|
* SegmentFault : https://segmentfault.com/u/huanghunbieguan
|
|
-------------------------------------------------------------------------------
|
|
|
|
## 待办清单
|
|
|
|
- [x] 支持图形加载完成后用户添加代理事件
|
|
- [x] 支持图形动态刷新全局内容
|
|
- [x] 支持图形动态刷新纯数据`(series)`内容
|
|
- [x] 支持色彩图层渐变效果
|
|
- [x] 支持横屏(全屏)效果
|
|
- [x] 支持自由设置图形渲染动画
|
|
- [x] 支持用户自由配置`AAOptions`模型对象属性
|
|
- [x] 支持图形堆叠
|
|
- [x] 支持图形坐标轴反转
|
|
- [x] 支持渲染散点图
|
|
- [x] 支持渲染柱形范围图
|
|
- [x] 支持渲染面积范围图
|
|
- [x] 支持渲染面积范围均线图
|
|
- [x] 支持渲染极地图
|
|
- [x] 支持渲染折线直方图
|
|
- [x] 支持渲染折线直方填充图
|
|
- [x] 支持渲染活动刻度仪表图
|
|
- [x] 支持为图形添加点击事件回调
|
|
- [x] 支持图形实时刷新纯数据并动态滚动
|
|
- [ ] 支持已渲染图形生成图片文件
|
|
- [ ] 支持生成图片文件保存至系统相册
|
|
|
|
|
|
[1]: https://raw.githubusercontent.com/adad184/MMTweenAnimation/master/Images/1.gif
|
|
[2]: https://raw.githubusercontent.com/adad184/MMTweenAnimation/master/Images/2.gif
|
|
[3]: https://raw.githubusercontent.com/adad184/MMTweenAnimation/master/Images/3.gif
|
|
[4]: https://raw.githubusercontent.com/adad184/MMTweenAnimation/master/Images/4.gif
|
|
[5]: https://raw.githubusercontent.com/adad184/MMTweenAnimation/master/Images/5.gif
|
|
[6]: https://raw.githubusercontent.com/adad184/MMTweenAnimation/master/Images/6.gif
|
|
[7]: https://raw.githubusercontent.com/adad184/MMTweenAnimation/master/Images/7.gif
|
|
[8]: https://raw.githubusercontent.com/adad184/MMTweenAnimation/master/Images/8.gif
|
|
[9]: https://raw.githubusercontent.com/adad184/MMTweenAnimation/master/Images/9.gif
|
|
[10]: https://raw.githubusercontent.com/adad184/MMTweenAnimation/master/Images/10.gif
|